The GBP/USD currency pair also began moving higher on Tuesday. The situation in the Middle East has not improved, and even Donald Trump did not make any new conciliatory statements towards Iran. The US president only stated that he is ready to end the war (which he himself initiated), even if the Strait of Hormuz remains under Iranian control (which has always belonged to Iran). There it is—the generosity from the American leader. You can keep what belongs to you, and we can end this war that we ourselves started. It is hard to say whether the markets believe Trump this time. If we look at oil prices, the answer is no. Therefore, we tend to think that the dollar's decline on Tuesday is in no way related to the statements from the White House leader.
Perhaps we are currently witnessing another upward correction, as no trading instrument can move without corrections. It is possible that the market is simply tired of buying the dollar solely on geopolitical grounds. Perhaps everyone fleeing from risks has already stocked up on dollars for years to come. Thus, we can fully assume that this decline in the GBP/USD pair may come to an end.
Yesterday, the third estimate of the UK GDP for the fourth quarter was published. Although this is not the most significant indicator, traders ignored it as well. Just in case, or perhaps just for company. It was revealed that the British economy slowed to 1% year-over-year growth in the fourth quarter, so, as with the Euro currency, a further decline of the British pound would have seemed more logical. However, the macroeconomic background is of little interest to the market right now; otherwise, the dollar would never have risen by 670 pips.
Interestingly, the pair may even start to recover all the losses incurred over the past two months. If the geopolitical factor is neutralized, it means the dollar has lost its only source of growth. Absolutely. Of course, if tomorrow, Trump begins an attack on Kharg Island, or Yemen blocks the Bab-al-Mandab Strait, or something else of similar magnitude occurs, traders may quickly return to buying the US currency. But if nothing like this happens, the dollar won't be able to rise for another month, two, or even a year simply because oil prices have increased, and the war in Iran continues. The war in Ukraine has been going on for five years; the currency market has long forgotten about it.
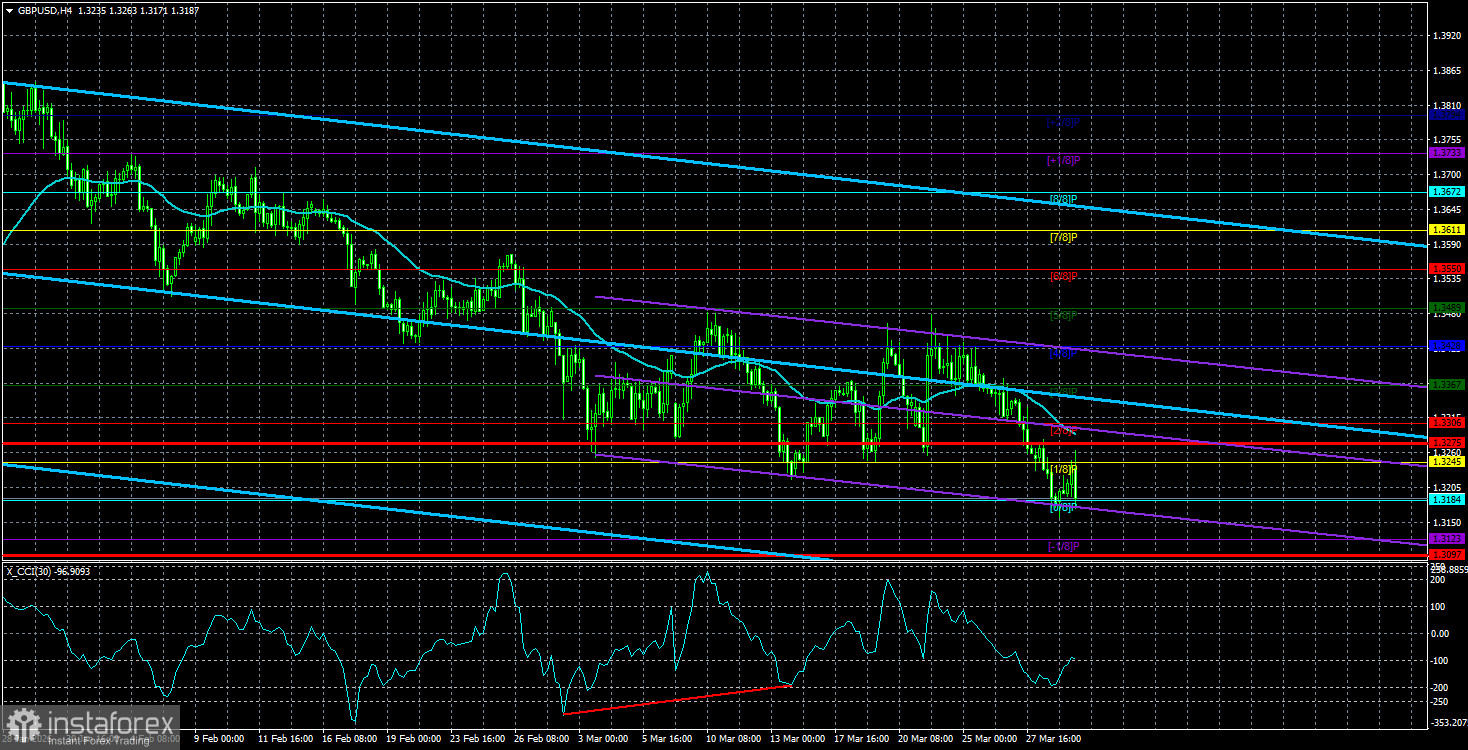
On the daily timeframe, the upward trend remains intact even after a drop of 700 pips. Thus, no matter what anyone says, we do not believe that 2026 will be dominated by the American dollar. Of course, the upward trend needs to be restored if traders have any plans at all. We've seen a prolonged, complicated movement, but it's a correction, as the preceding growth was stronger.
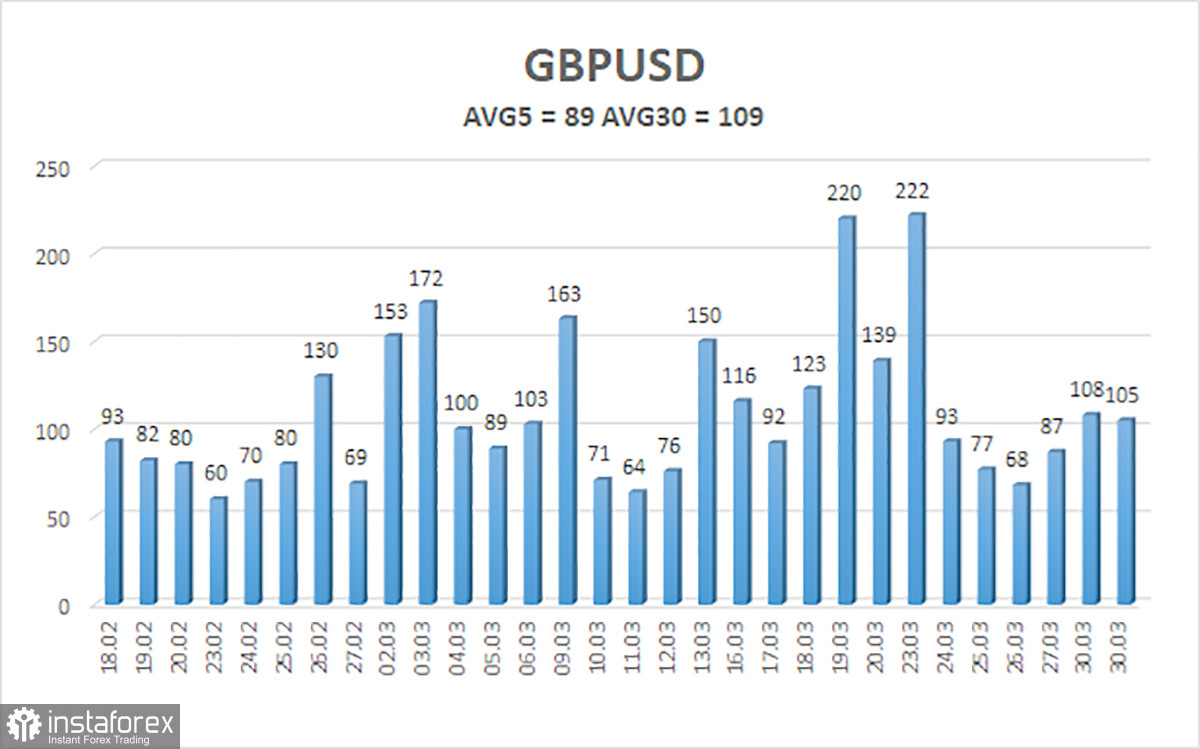
The average volatility of the GBP/USD pair over the past five trading days as of April 1 is 89 pips, which is considered "average." On Wednesday, April 1, we expect the pair to trade within a range constrained by 1.3097 and 1.3275. The upper channel of the linear regression has turned downward, indicating a trend change. The CCI indicator has entered the oversold area twice and has also formed a "bullish" divergence, which once again warns of the completion of the downward trend. However, geopolitics remains more significant than technical signals.
Nearby Support Levels:
- S1 – 1.3184
- S2 – 1.3123
- S3 – 1.3062
Nearby Resistance Levels:
- R1 – 1.3245
- R2 – 1.3306
- R3 – 1.3367
Trading Recommendations:
The GBP/USD currency pair has been moving down for a month and a half, but its long-term prospects have not changed. Trump's policies will continue to exert pressure on the US economy, so we do not expect the US currency to grow in 2026. Thus, long positions with a target of 1.3916 and above remain relevant if the price is above the moving average. If the price is below the moving average line, short positions can be considered, with targets at 1.3123 and 1.3097, based on geopolitical factors. In recent weeks, almost all news and events have turned against the British pound, prolonging the downward trend.
Explanations for Illustrations:
- Linear regression channels help determine the current trend. If both are directed in the same way, then the trend is currently strong.
- The moving average line (settings 20,0, smoothed) defines the short-term trend and the direction in which trading should currently be conducted.
- Murray levels are target levels for movements and corrections.
- Volatility levels (red lines) indicate the likely price channel the pair is likely to trade in the next day, based on current volatility readings.
- The CCI indicator entering the oversold area (below -250) or the overbought area (above +250) indicates that a trend reversal is approaching in the opposite direction.