Analysis EUR/USD 5M
The EUR/USD pair showed no notable moves on Monday because there were no drivers. Neither the Eurozone nor the US released any important publications or hosted notable events on the first trading day. At the open, the market rushed to price in events in France, but that momentum quickly faded. As we said, riots and strikes hurt the economy and put pressure on France's budget, but they aren't enough to justify the euro — after a month-long decline — falling another 200–300 pips. The euro's drop therefore ended quickly, and by day's close the single currency had lost almost nothing. In our view, the upside move will continue despite the near absence of major events this week. We see no grounds for further dollar strength. The recent dollar rally could be explained as a weekly-timeframe correction or by the speculative nature of the move, but even those explanations are running out of steam. The euro has fallen too far, for too long, and too irrationally. The eurozone economy is not in such dire condition that the currency should plunge into an abyss. Markets have broadly ignored European Central Bank policy recently.
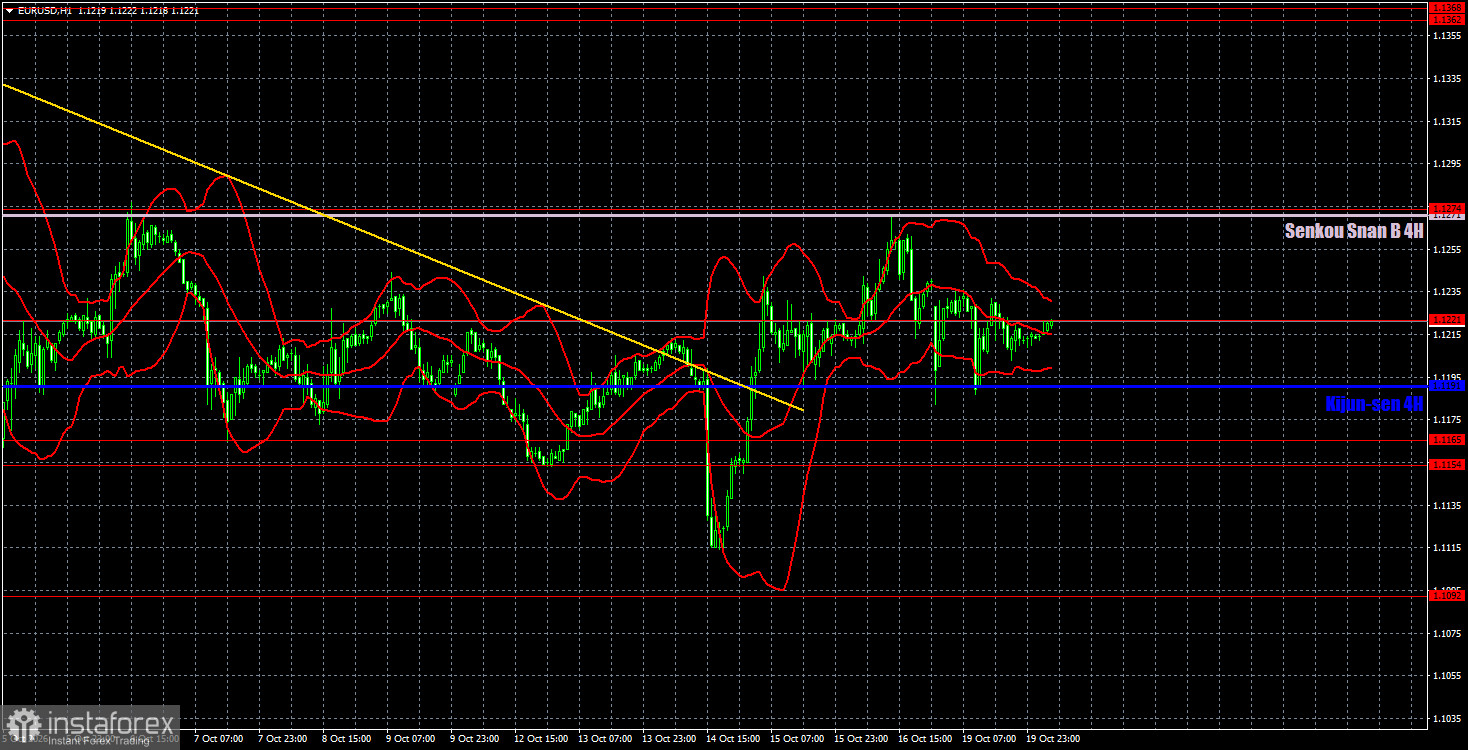
Technically, the downtrend may be complete since the trendline has been breached. For five consecutive weeks, the market bought the dollar on any pretext, but every story ends. The euro is now heading toward the Senkou Span B line. We believe price should clear that line and begin a sustained uptrend.
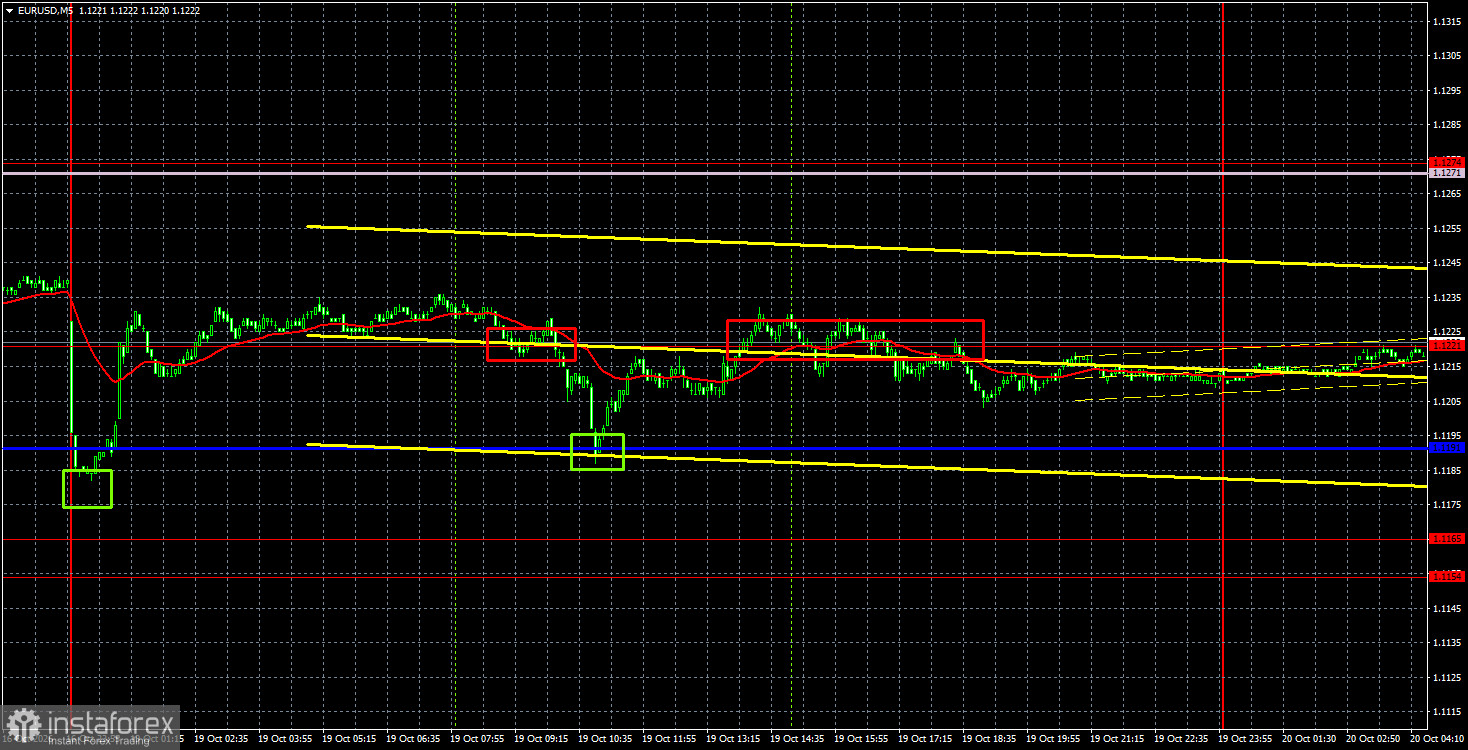
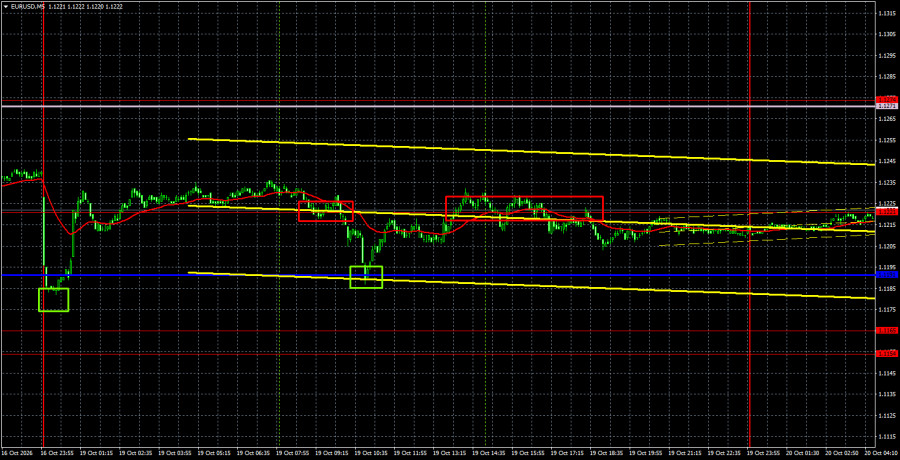
On the 5-minute chart, Monday produced several trading signals. First, price cleared 1.1221 and fell to the critical line. Then it bounced from the critical line and returned to 1.1221. Later, it bounced again from 1.1221, though less precisely. The first two trades could have yielded small profits for traders, given the day's low volatility.
COT Report
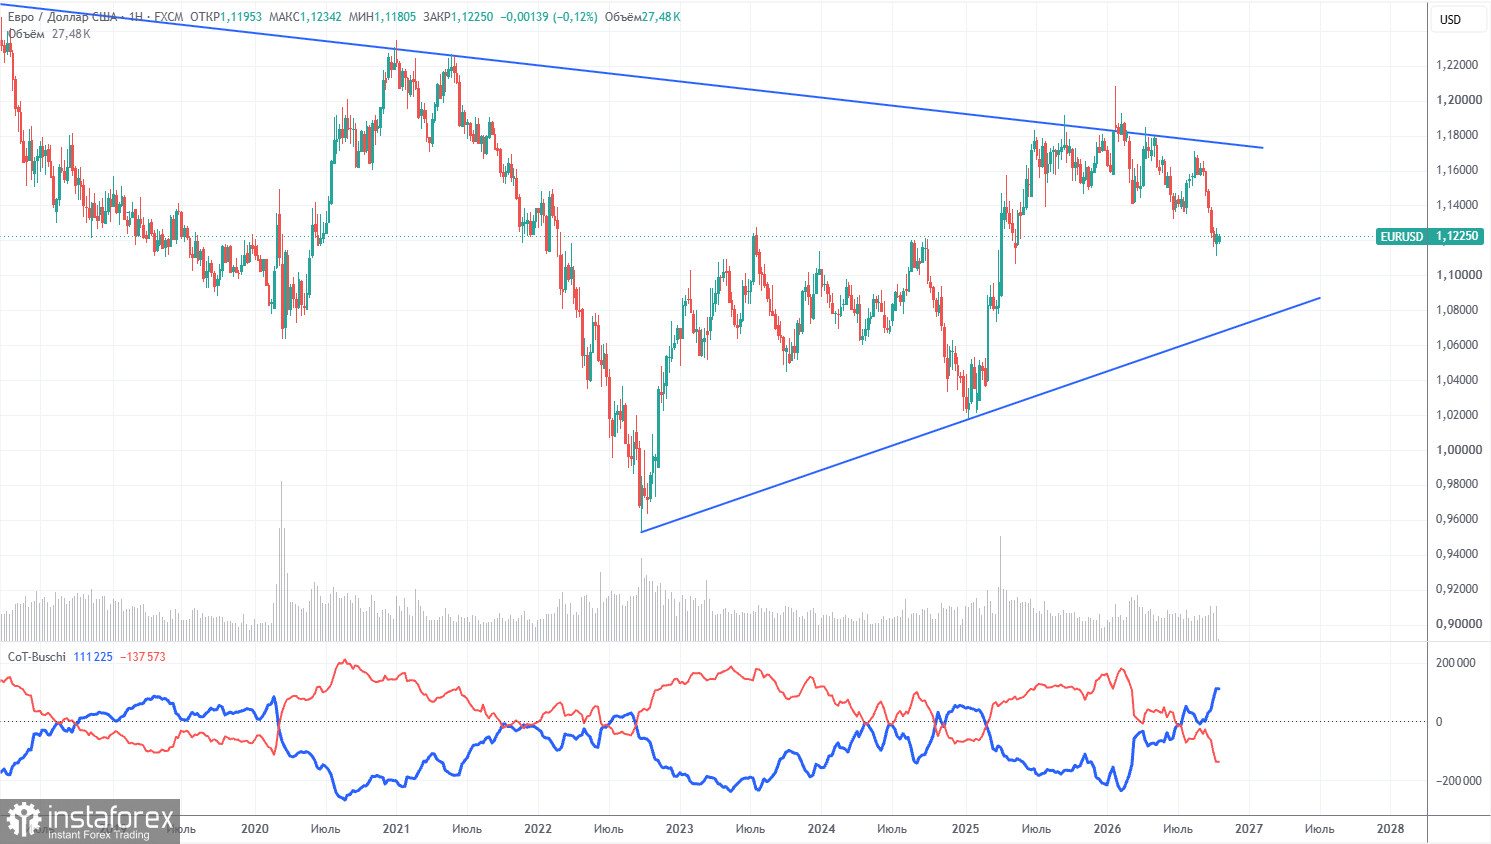
The latest COT report is dated October 13. The weekly chart shows that non-commercial traders' net position remains bearish and has declined substantially in 2026 due to geopolitical events. Over the past eight months, traders have reduced euro exposure in favor of the US dollar. Donald Trump's policies have not changed, but the dollar has served as a "reserve" currency for a time.
However, we still see no fundamental basis for further long-term strengthening of the US dollar. The war in the Middle East made the dollar temporarily very attractive, and the Federal Reserve's monetary stance surprised the dollar for the second time this year. In the long run, the euro could fall to $1.08 (the trendline), but the uptrend will remain relevant. Recently, the market has incorporated only dollar-positive factors and ignored everything else.
The positioning of the red and blue indicator lines points to the bears' advantage. Last reporting week, long positions in the "Non-commercial" group fell by 20,100, while shorts rose by 18,200. Accordingly, net non-commercial positions fell by another 38,300 contracts over the week.
Analysis EUR/USD 1H
On the hourly timeframe, EUR/USD finally has the opportunity to form an uptrend. On the daily and weekly timeframes, the chances of a strong, lasting trend remain high. Throughout 2026, the dollar was aided by "black swans" arriving in market after market. However, any long-term rise in the dollar is a correction. Perhaps that correction has now ended?
For October 20 we highlight the following trading levels — 1.1092, 1.1154–1.1165, 1.1221, 1.1274, 1.1362–1.1368, 1.1461–1.1473, 1.1536–1.1542, 1.1585, 1.1657–1.1665, as well as Senkou Span B (1.1271) and Kijun-sen (1.1191). Ichimoku lines may shift intraday and should be considered when defining trading signals. Don't forget to move your stop-loss to breakeven once price has moved 15 pips in the intended direction to protect against potential losses if a signal proves false.
On Tuesday, the eurozone will publish two ZEW economic-sentiment indices (including the German release), and the US will release housing starts and building permits. We consider these releases secondary.
Summary of the above analysis:
Traders may consider short positions around 1.1154–1.1165 and 1.1191 if price rebounds from the Senkou Span B line. If price breaks above 1.1221, consider long positions in the 1.1271–1.1274 area.
Explanations for the illustrations:
- Price support and resistance levels (resistance/support) — thick red lines around which movement may end. They are not sources of trading signals.
- Kijun-sen and Senkou Span B lines — Ichimoku indicator lines transferred to the hourly timeframe from the 4-hour timeframe. They are strong lines.
- Extreme levels — thin red lines from which the price previously bounced. They are sources of trading signals.
- Yellow lines — trendlines, trend channels, and any other technical patterns.
- Indicator 1 on the COT charts — the size of the net position of each trader category.